Google AI Overviews appear on 74% of New Zealand commercial searches
We tested 1,000 commercially relevant Google New Zealand searches across 20 industries and five search intents. AI Overviews appeared on 739 of them. When one appeared, it was the first thing on the page 88% of the time. For advice and pricing searches the feature was close to universal. For local-provider searches it was the exception.
of all 1,000 searches showed an AI Overview
739 of 1,000 searchesof advice searches showed an AI Overview
193 of 200. Cost searches: 96.0%of local-provider searches showed one
33 of 200. An 80-point gapof AI Overviews were the first element on the page
653 of 739 sat at position 1What 1,000 New Zealand searches showed
- Overall prevalence: AI Overviews appeared on 739 of 1,000 searches, or 73.9%. Because the sample gives every industry and intent the same weight, this is a fair comparison figure, not a claim about every search made in New Zealand.
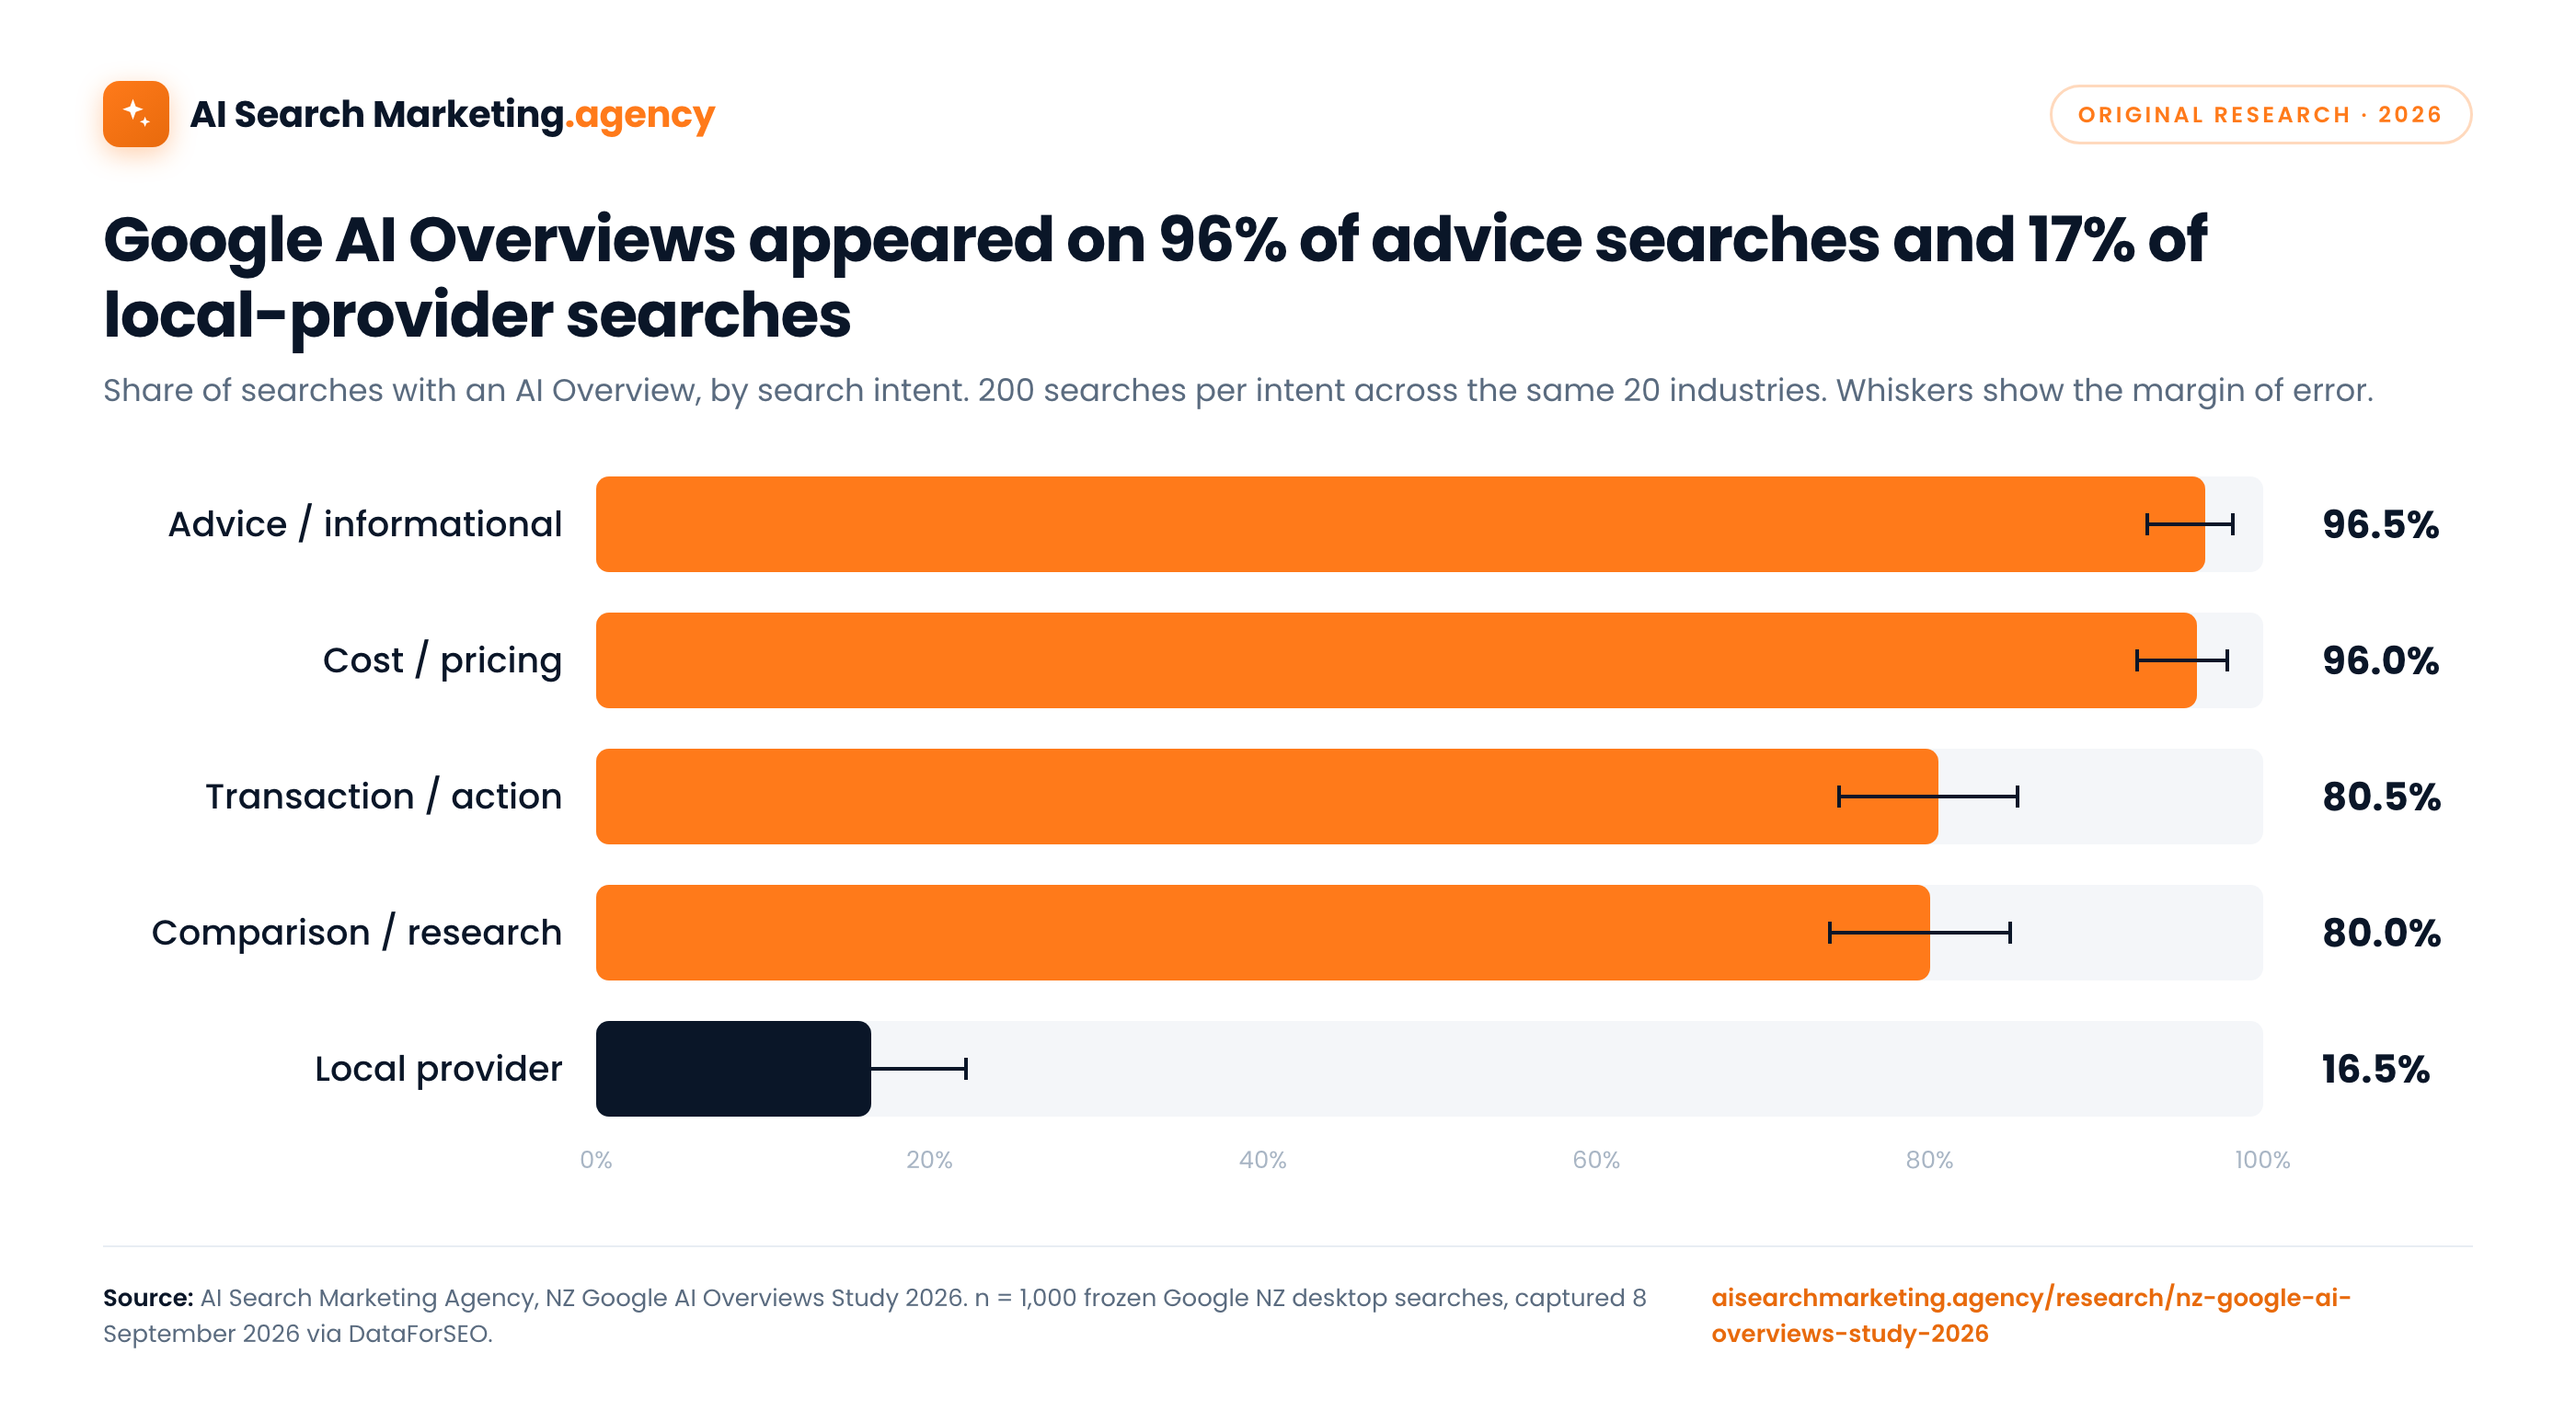
- Intent is the dividing line: 96.5% of advice searches and 96.0% of cost or pricing searches showed an AI Overview. Transaction searches (80.5%) and comparison searches (80.0%) sat in the middle. Local-provider searches came in at 16.5%.
- Position one: the AI Overview was the first returned element for 653 searches, 65.3% of the whole sample. 660 searches (66.0%) had an AI Overview above the first conventional organic result.
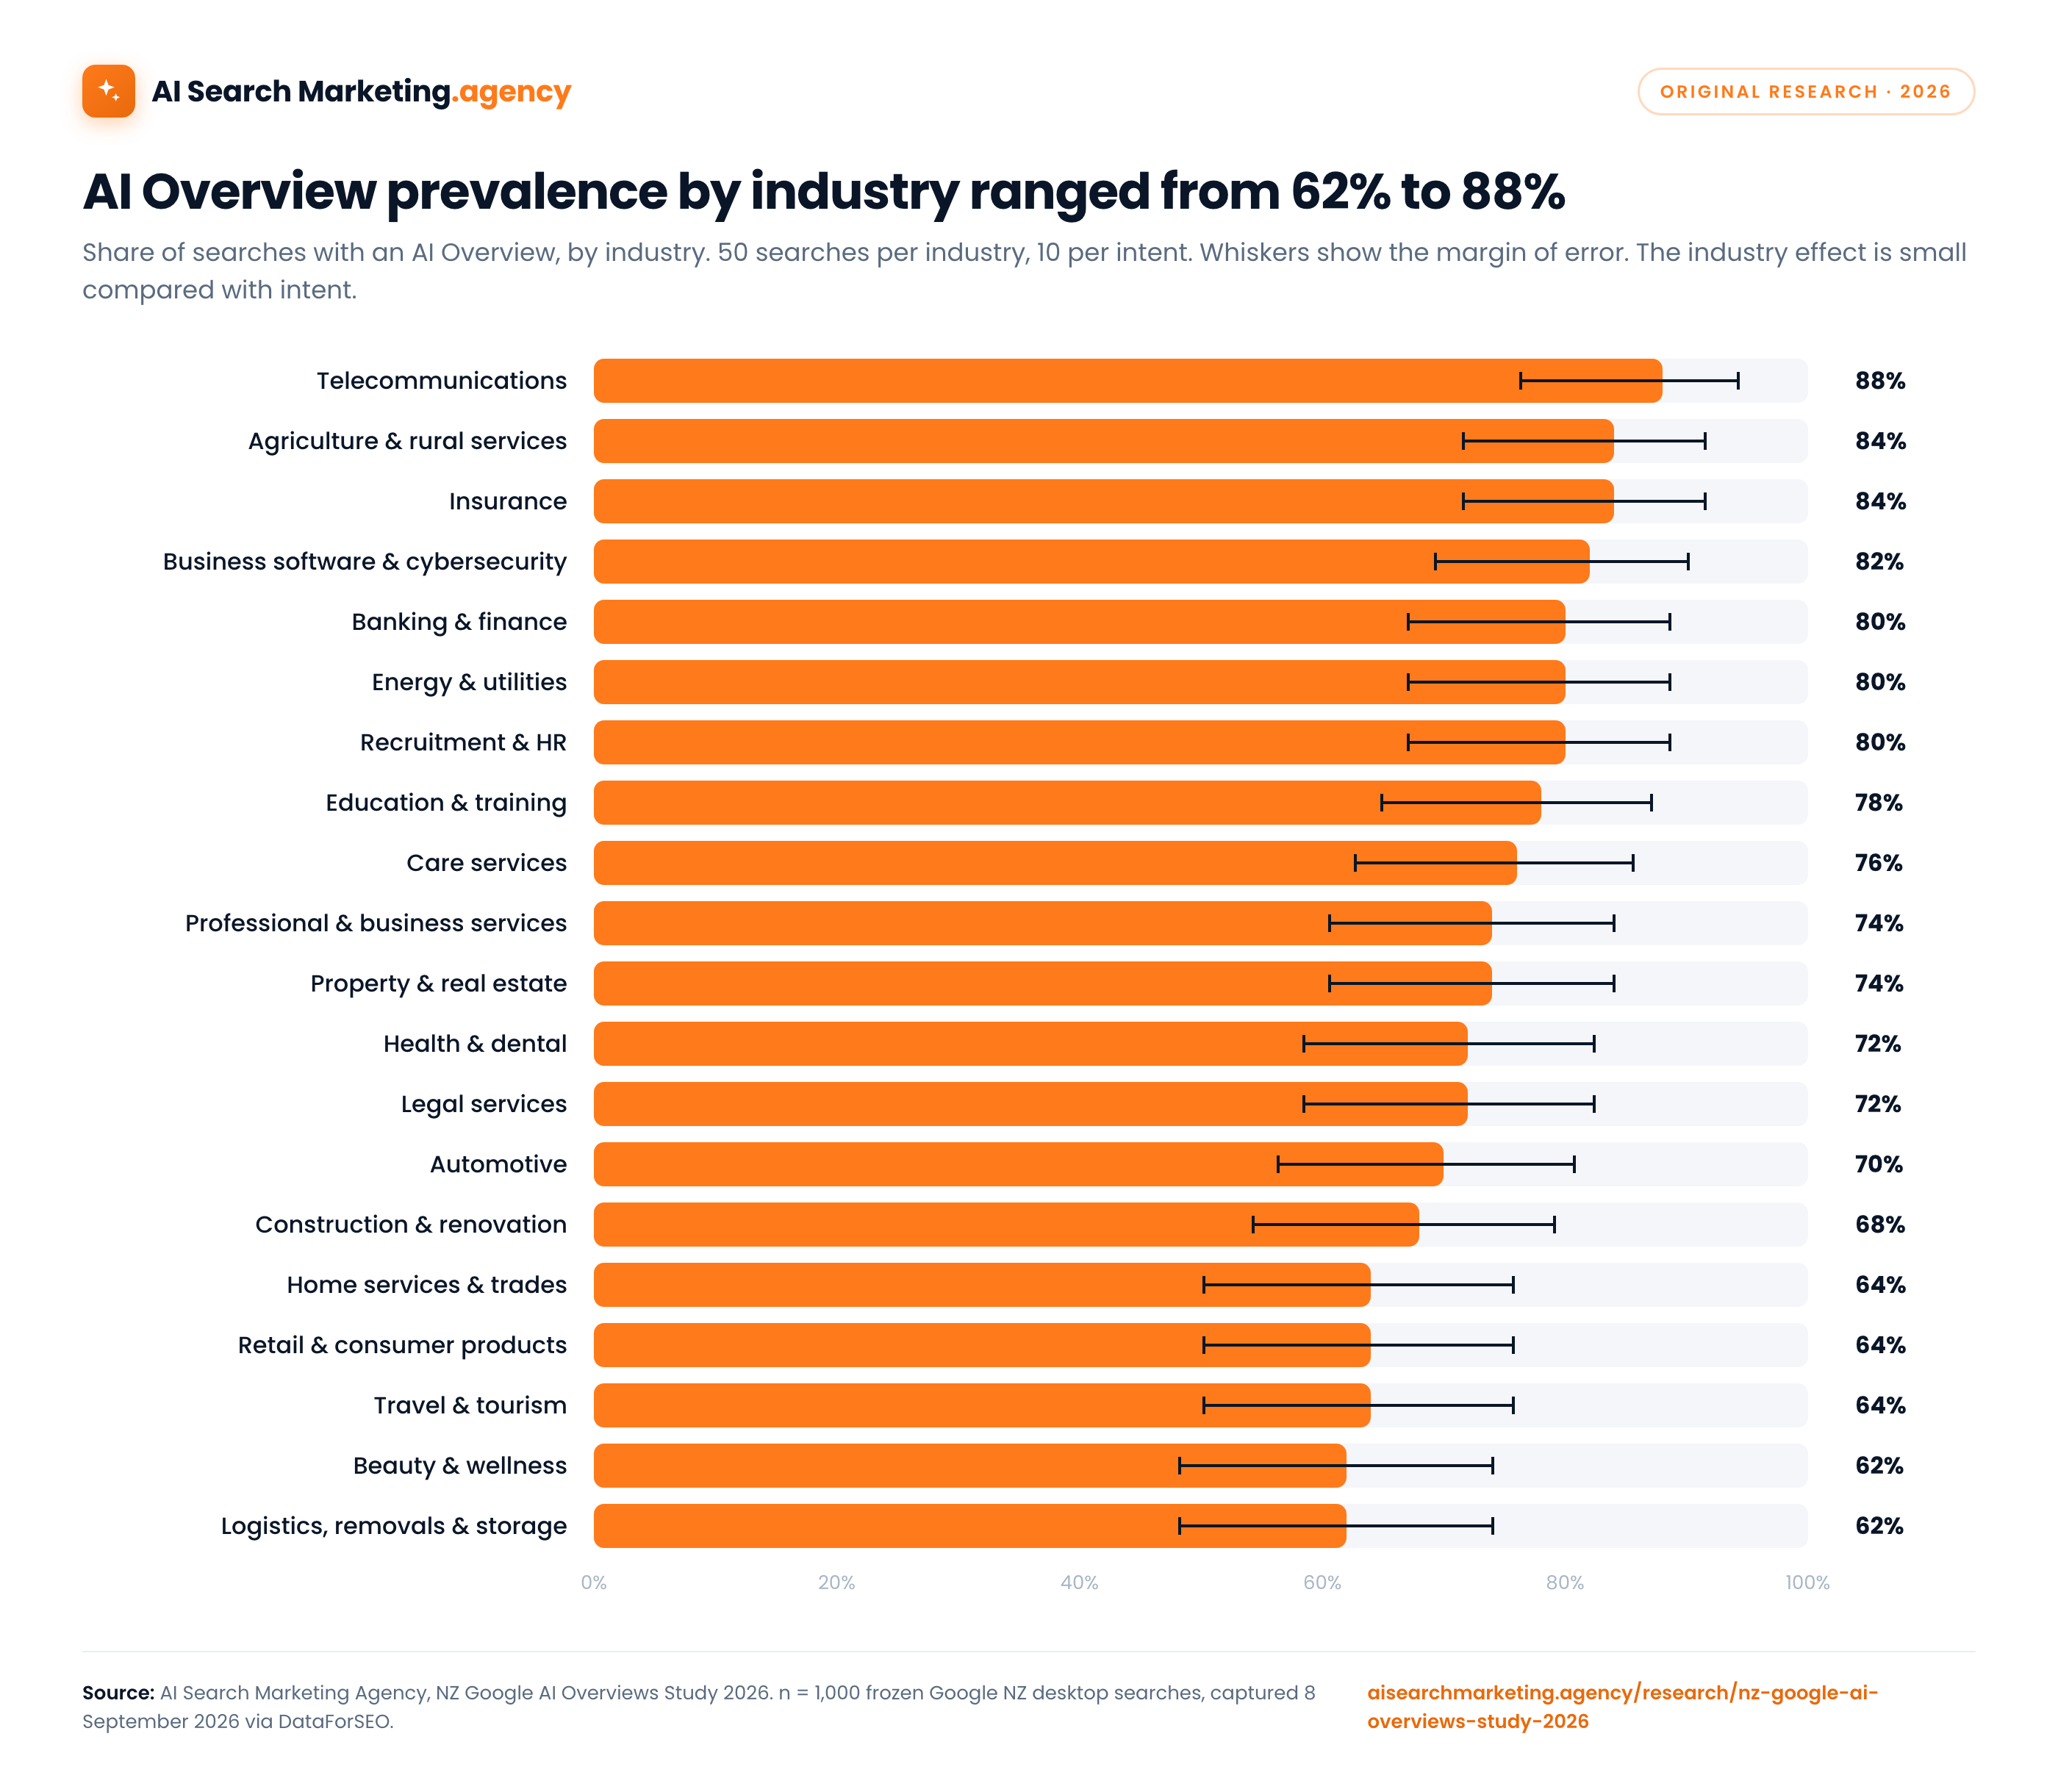
- Industry mattered less than you would guess: rates ranged from 62% (beauty and wellness; logistics, removals and storage) to 88% (telecommunications), and the effect was statistically small next to intent.
- Weighting changes the answer: on the 275 searches with positive Google Ads volume, a volume-weighted rate was 27.0%, because a handful of high-volume local and booking terms dominate that subset.
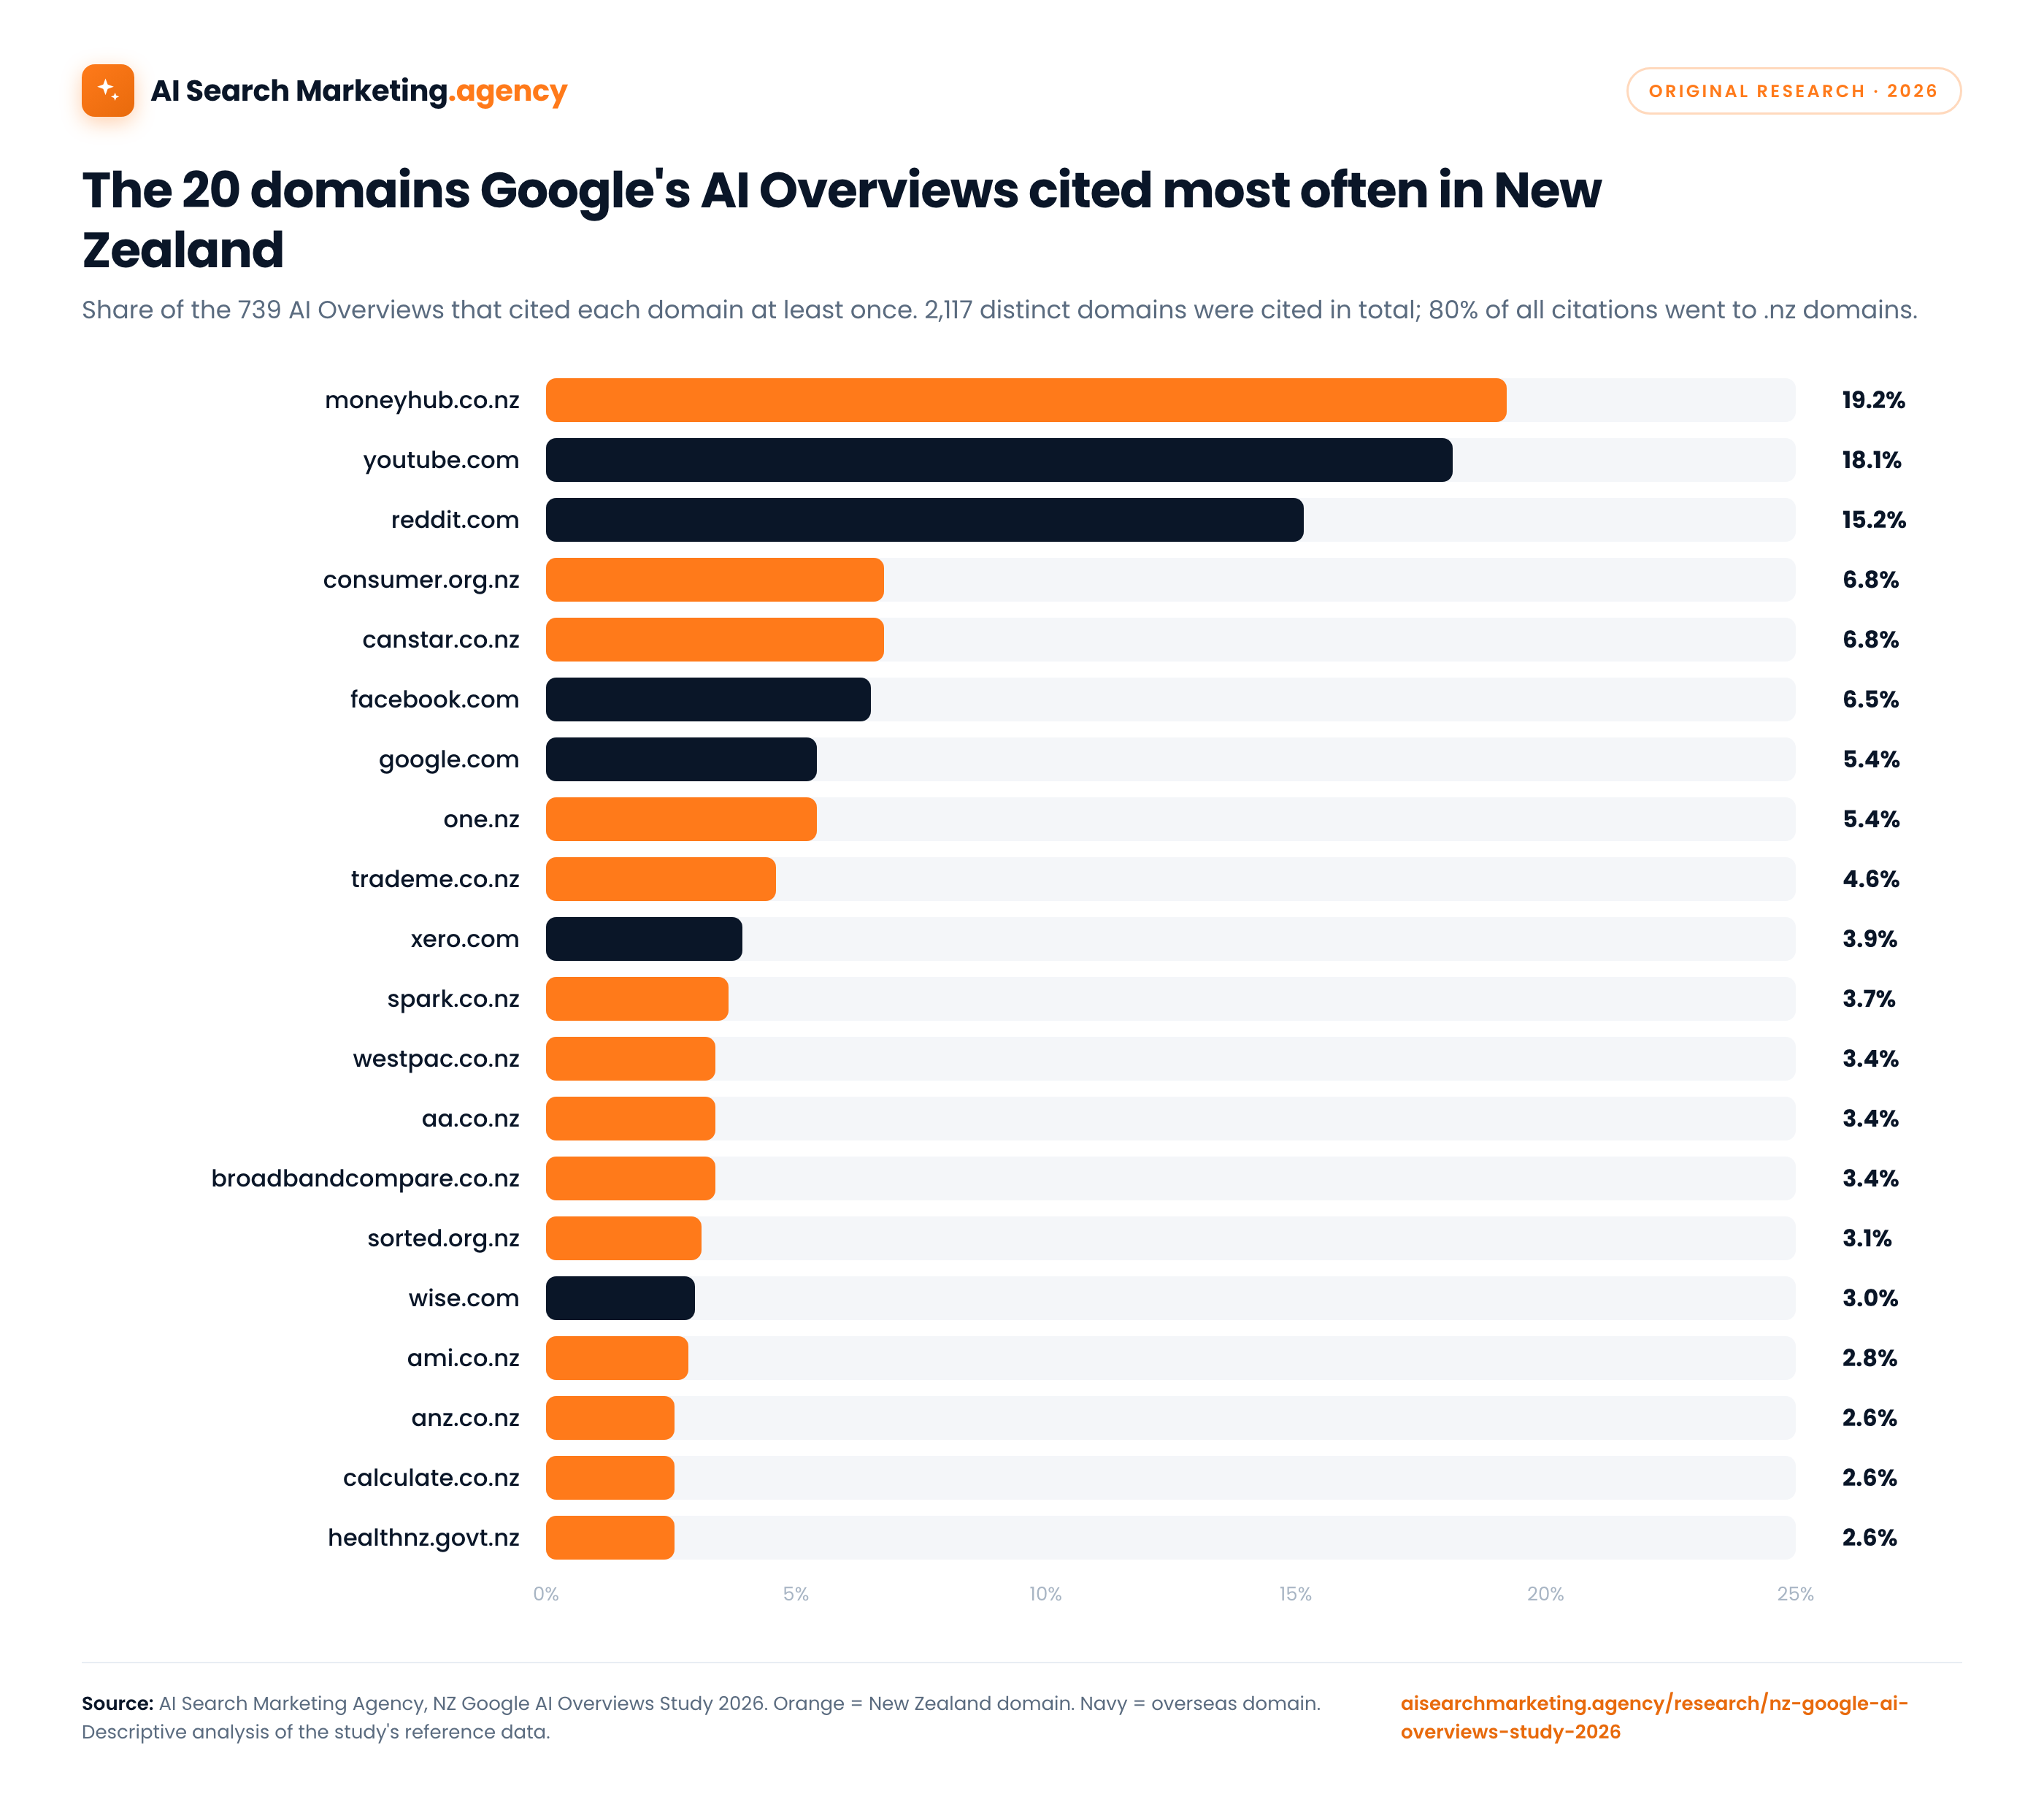
- New Zealand sites get the citations: 80% of AI Overview citations went to .nz domains. moneyhub.co.nz, youtube.com and reddit.com were the three most cited sources.
- Repeatable: we re-ran 100 of the searches shortly afterwards, one from every industry and intent combination, and got the same answer on AI Overview presence 93% of the time.
Intent, not industry, decides whether an AI Overview appears
The single most important result in the study is an 80-point gap. Google produced an AI Overview for almost every advice and cost query in the sample, and for only one in six local-provider queries. Because every intent group contains the same 200-query allocation across the same 20 industries, this is not one sector skewing the numbers.

| Search intent | Searches | With AI Overview | Prevalence | Margin of error range | AI Overview at position 1 |
|---|---|---|---|---|---|
| Advice / informational | 200 | 193 | 96.5% | 93.0% to 98.3% | 184 |
| Cost / pricing | 200 | 192 | 96.0% | 92.3% to 98.0% | 178 |
| Transaction / action | 200 | 161 | 80.5% | 74.5% to 85.4% | 137 |
| Comparison / research | 200 | 160 | 80.0% | 73.9% to 85.0% | 129 |
| Local provider | 200 | 33 | 16.5% | 12.0% to 22.3% | 25 |
The link between search intent and AI Overview presence was by far the strongest pattern in the data, far stronger than any industry effect. The pattern also makes practical sense. Advice and price questions invite synthesis: definitions, steps, considerations, ranges and caveats. A query for a specific nearby provider is more naturally answered with a local pack, a map or a directory. Transactional and comparison searches sit between those extremes.
That does not make local SEO safe. Local-provider searches still triggered AI Overviews 16.5% of the time, and the advice, cost and comparison searches that come earlier in the same customer journey were heavily exposed.
AI Overviews were usually the first thing on the page
How often the feature appears understates how visible it is. When an AI Overview appeared, it was normally the very first element on the results page.

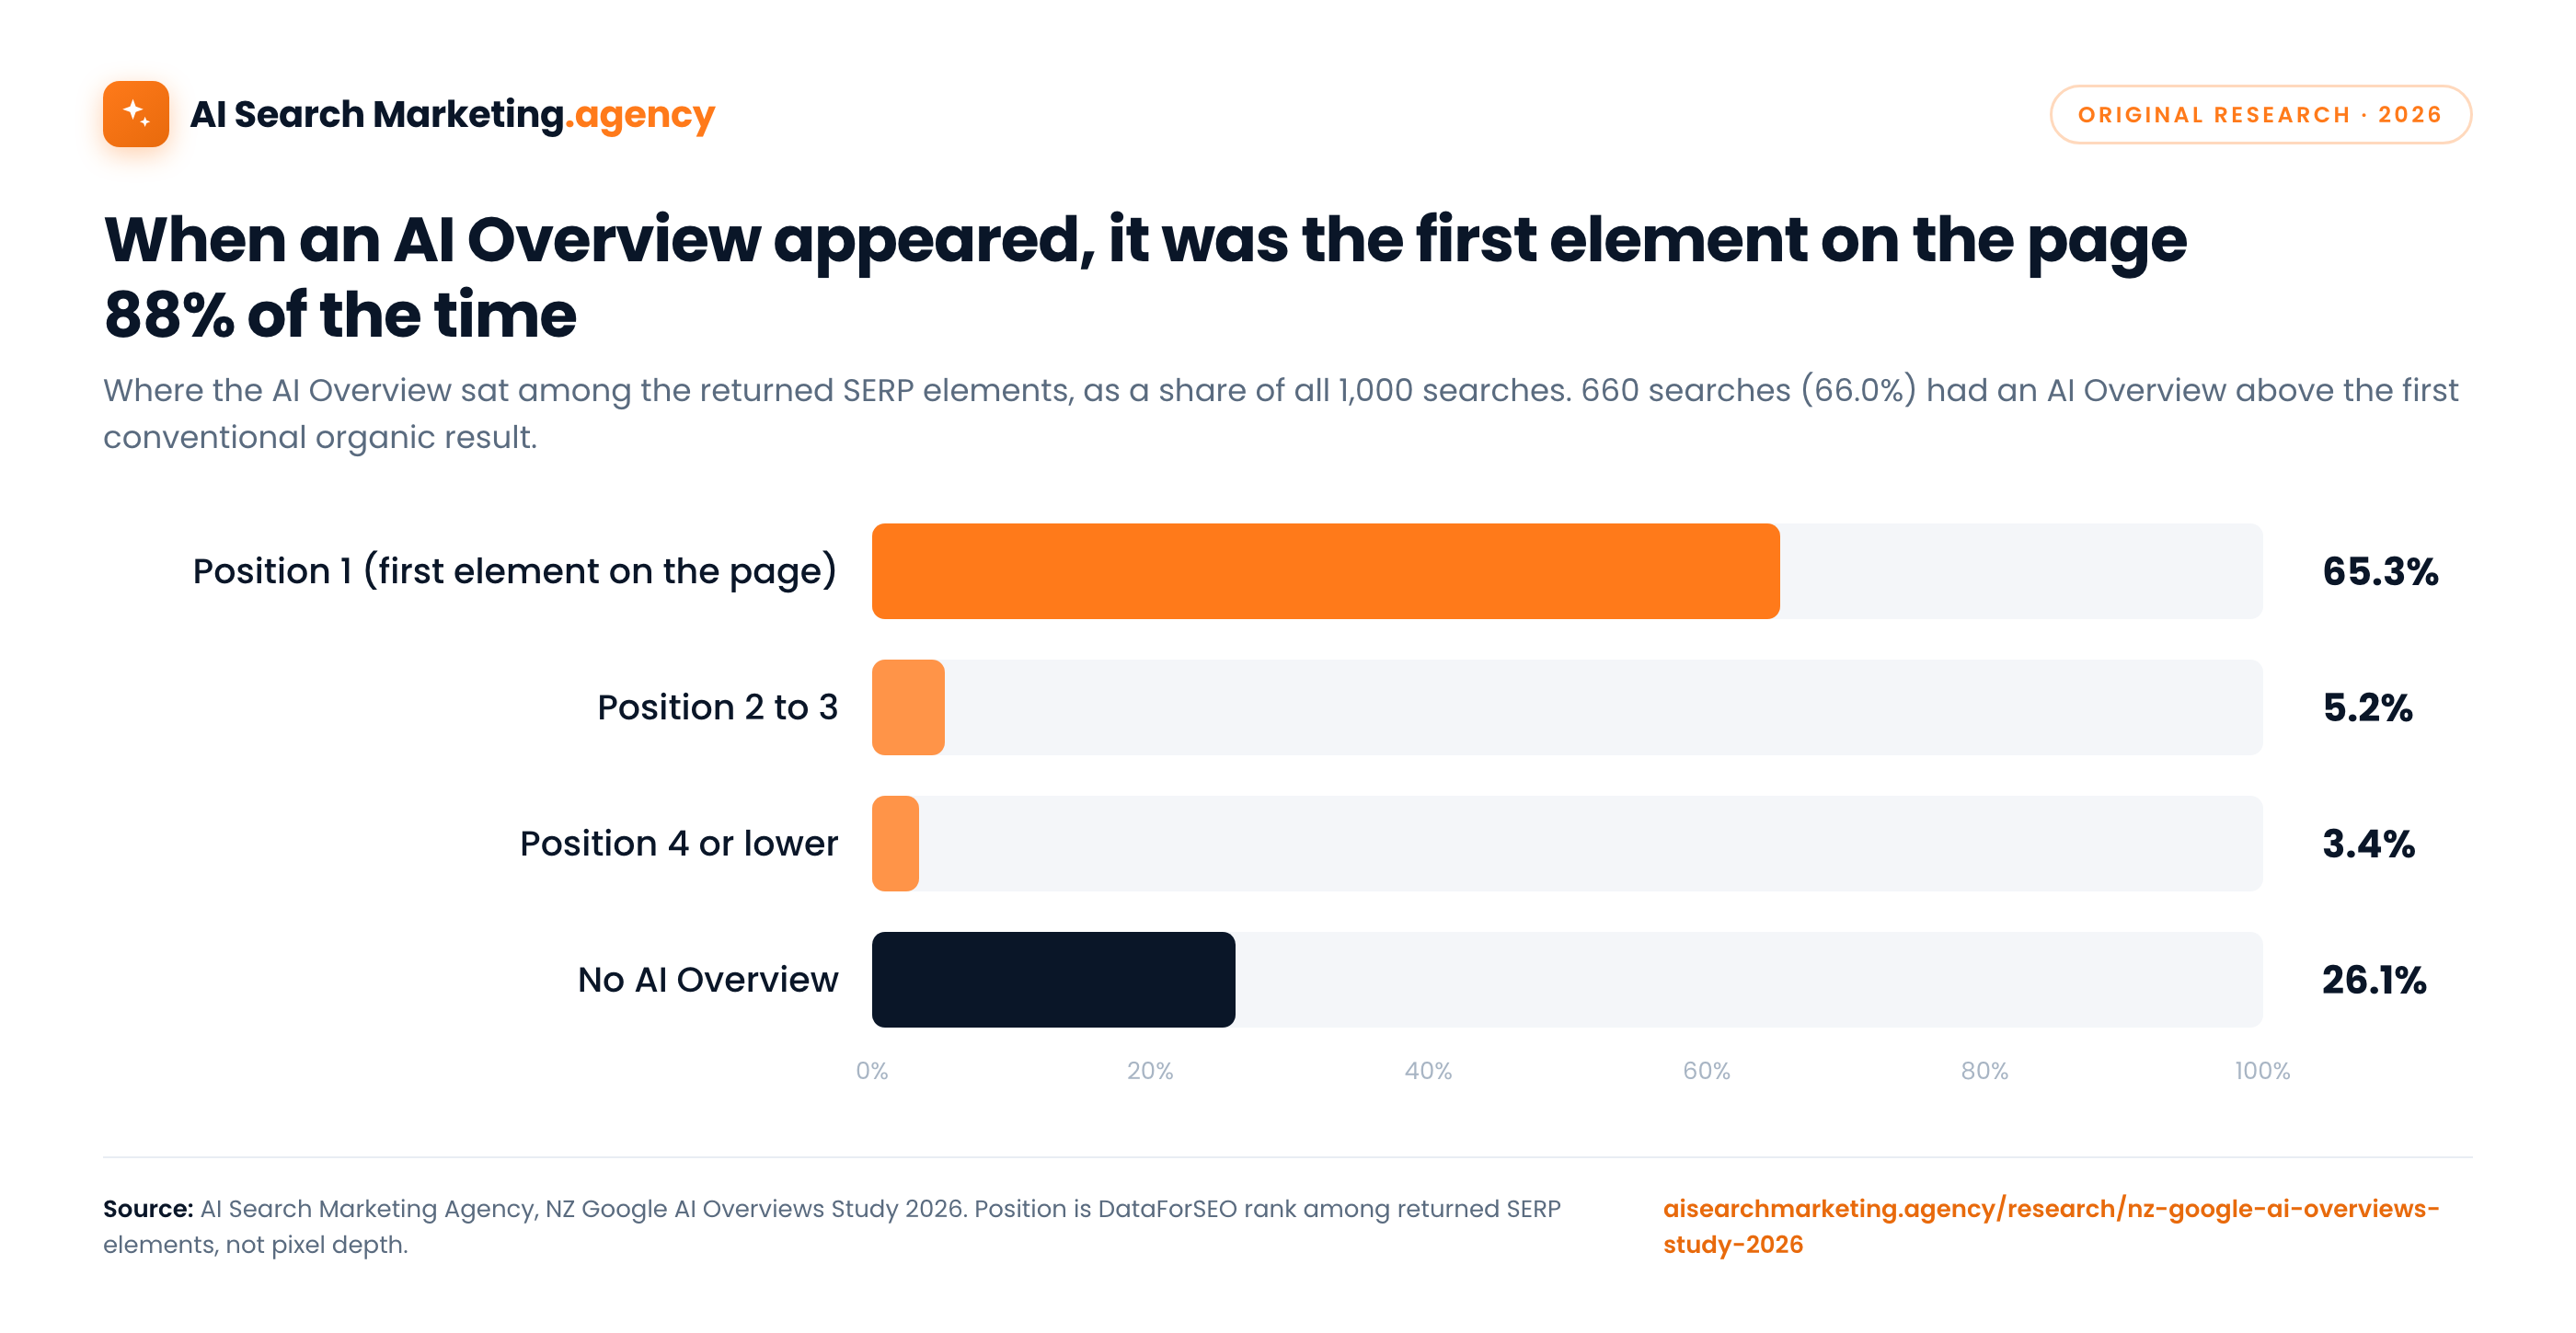
- 653 AI Overviews appeared at absolute position 1 (65.3% of all searches, 88.4% of searches with an AI Overview).
- 52 appeared at positions 2 to 3, and 34 at position 4 or lower.
- Among the 739 searches with an AI Overview, 95.4% were in the top three returned elements and 89.3% appeared before the first conventional organic result.
- 261 searches had no AI Overview at all.
"Position" here means the order of elements on the results page as returned by our data provider, not how much screen space the AI Overview took up. Even with that limitation, the concentration at position one shows the feature is prominent rather than buried.
Industry rates ranged from 62% to 88%
Telecommunications had the highest observed rate at 88%. Agriculture and rural services and insurance followed at 84%, then business software and cybersecurity at 82%. At the lower end, beauty and wellness and logistics, removals and storage each recorded 62%.

| Industry | With AI Overview | Prevalence | Margin of error range | At position 1 |
|---|---|---|---|---|
| Telecommunications | 44 of 50 | 88% | 76% to 94% | 39 |
| Agriculture & rural services | 42 of 50 | 84% | 71% to 92% | 32 |
| Insurance | 42 of 50 | 84% | 71% to 92% | 35 |
| Business software & cybersecurity | 41 of 50 | 82% | 69% to 90% | 40 |
| Banking & finance | 40 of 50 | 80% | 67% to 89% | 30 |
| Energy & utilities | 40 of 50 | 80% | 67% to 89% | 33 |
| Recruitment & HR | 40 of 50 | 80% | 67% to 89% | 38 |
| Education & training | 39 of 50 | 78% | 65% to 87% | 37 |
| Care services | 38 of 50 | 76% | 63% to 86% | 33 |
| Professional & business services | 37 of 50 | 74% | 60% to 84% | 35 |
| Property & real estate | 37 of 50 | 74% | 60% to 84% | 35 |
| Health & dental | 36 of 50 | 72% | 58% to 83% | 35 |
| Legal services | 36 of 50 | 72% | 58% to 83% | 36 |
| Automotive | 35 of 50 | 70% | 56% to 81% | 29 |
| Construction & renovation | 34 of 50 | 68% | 54% to 79% | 32 |
| Home services & trades | 32 of 50 | 64% | 50% to 76% | 31 |
| Retail & consumer products | 32 of 50 | 64% | 50% to 76% | 20 |
| Travel & tourism | 32 of 50 | 64% | 50% to 76% | 26 |
| Beauty & wellness | 31 of 50 | 62% | 48% to 74% | 30 |
| Logistics, removals & storage | 31 of 50 | 62% | 48% to 74% | 27 |
Industry differences were real but modest. Each industry figure rests on 50 searches, so the margin of error is much wider than for the overall result and neighbouring industries overlap heavily. Use the table to spot broad patterns, not as a permanent league table.
Every industry showed the same intent pattern
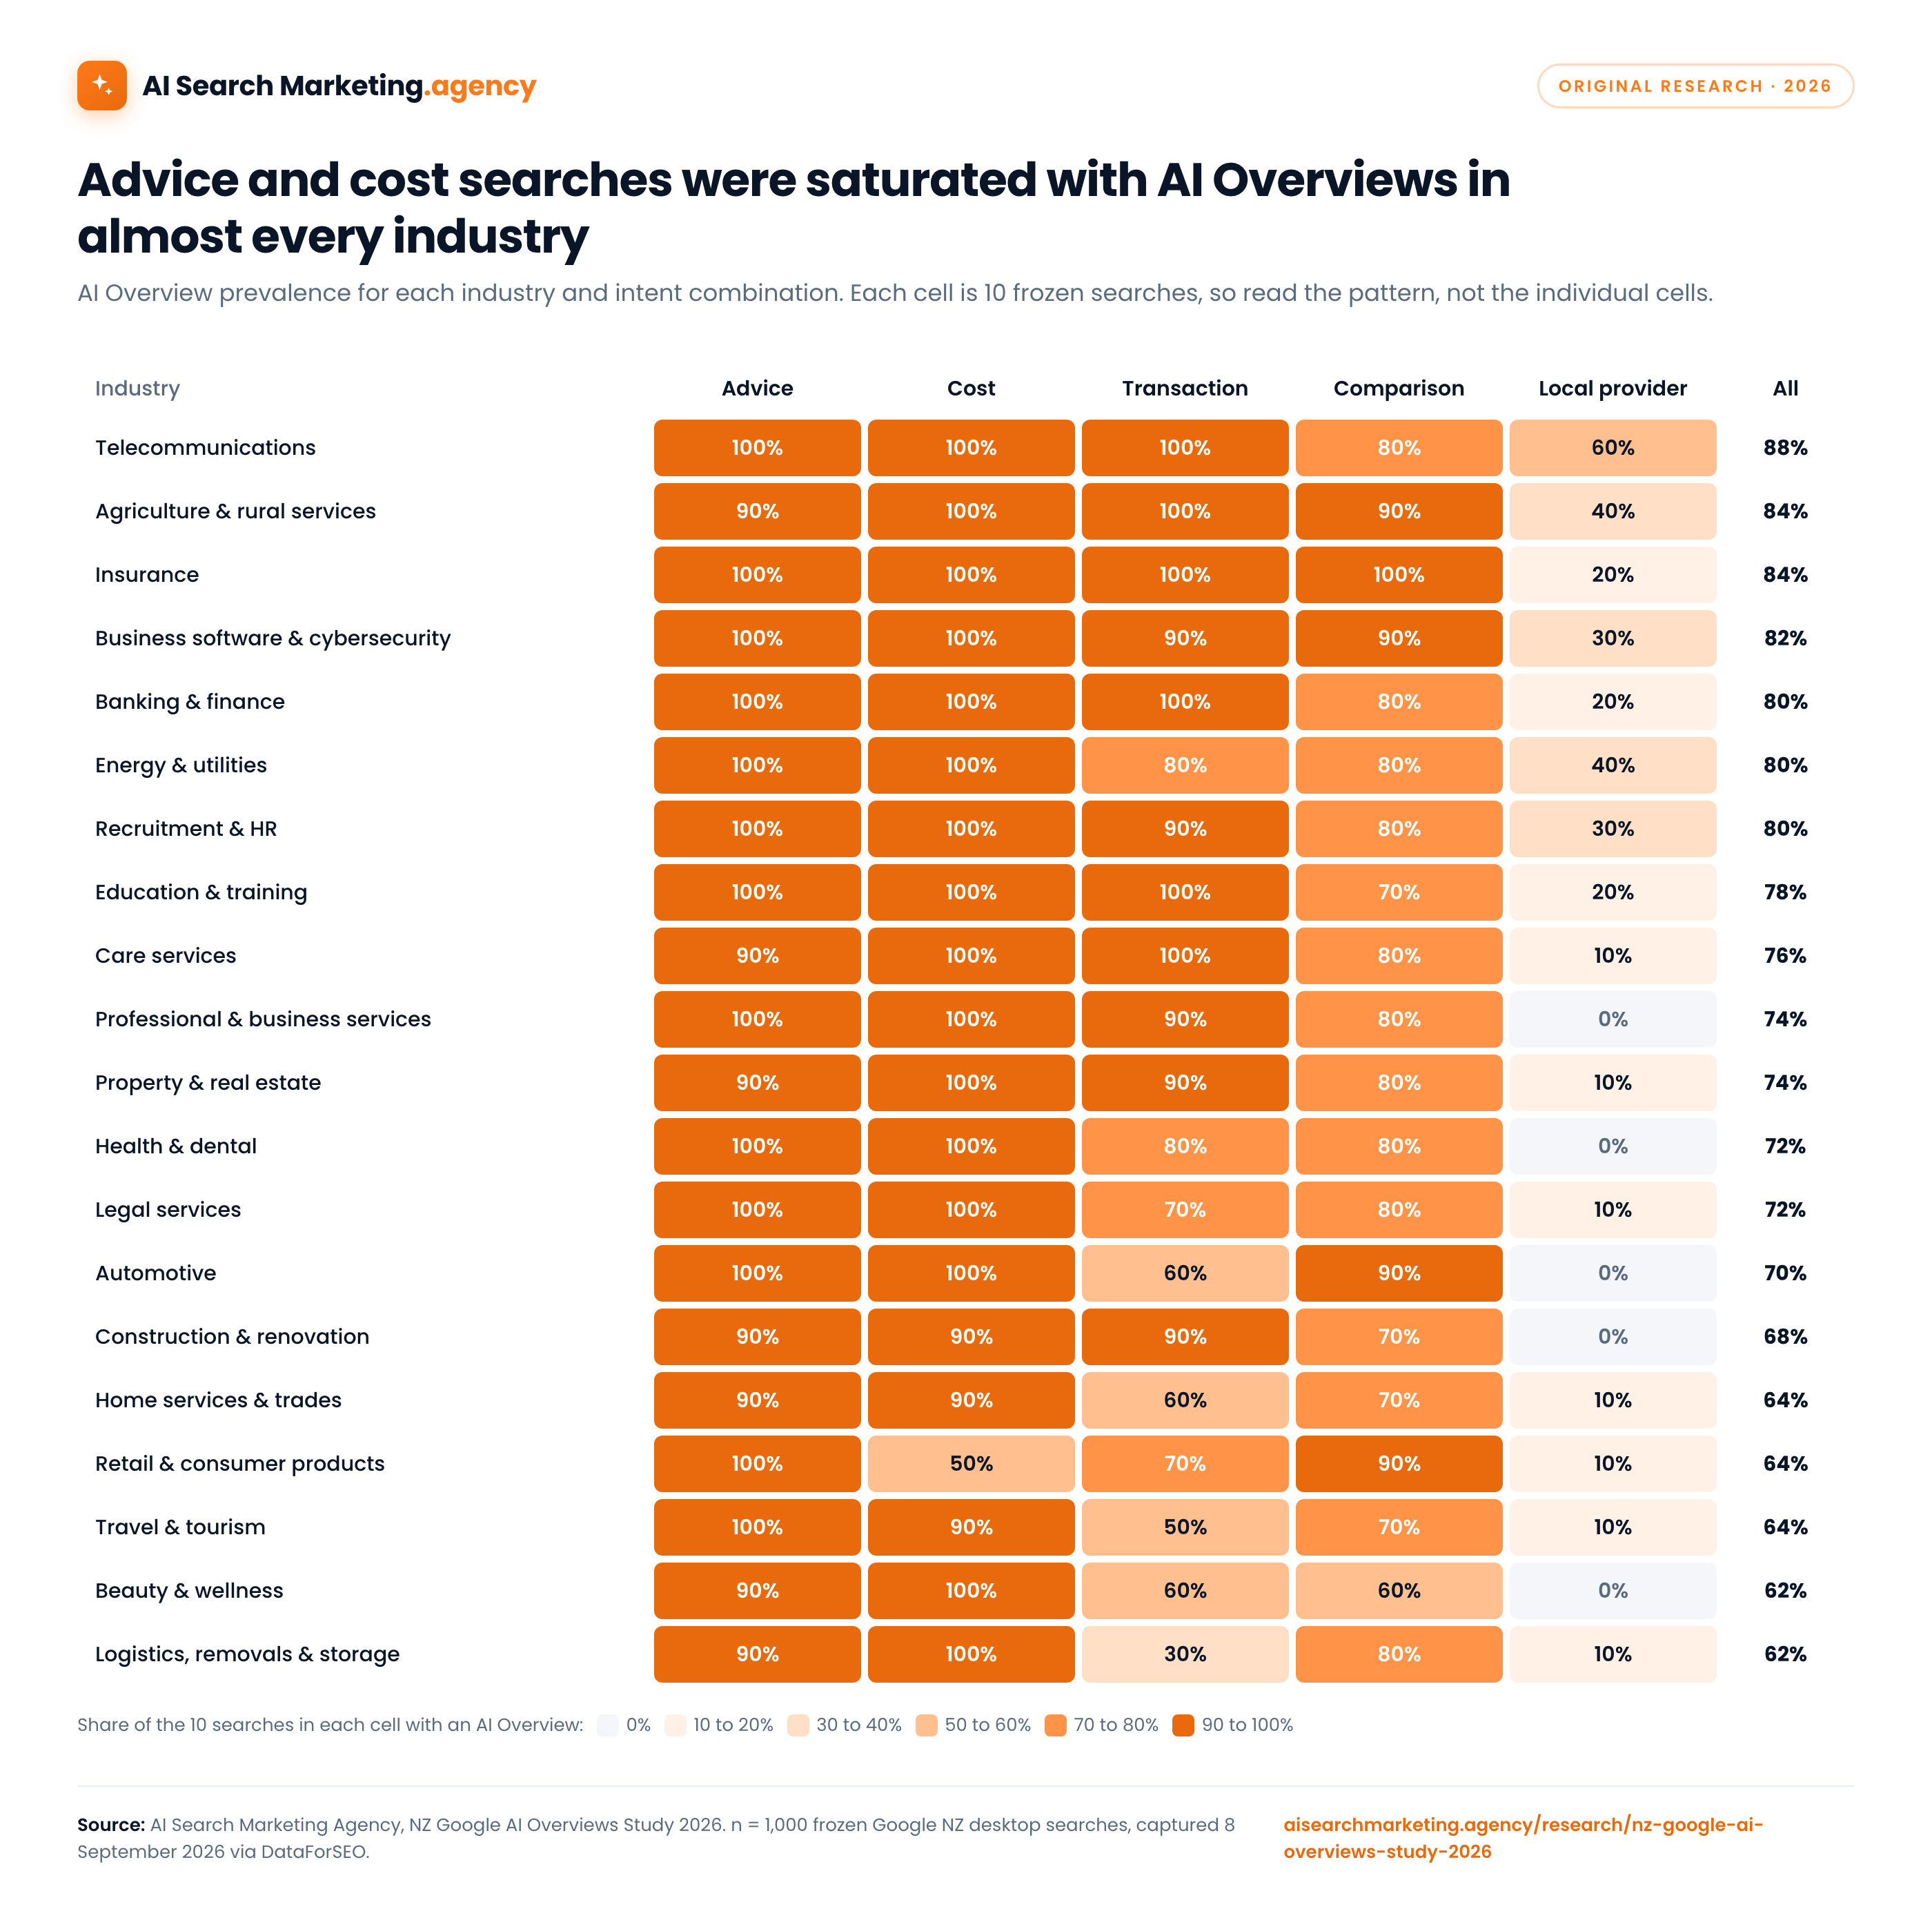
The industry-by-intent view is where the story becomes hard to argue with. Cost and advice queries were saturated with AI Overviews in almost every sector. Local-provider queries were usually not, and in six industries none of the ten local queries produced one.

Weighting by search volume gives a very different number
The 73.9% figure answers a comparison question: how often did AI Overviews appear across this balanced set of commercially important search types? It is not a share of search traffic.
Google Ads search-volume data was available for 275 of the 1,000 searches. When we weighted only those 275 by their monthly volume, the AI Overview rate dropped to 27.0%. The reason is concentration: a few big local-provider terms make up most of the measured volume, and AI Overviews appeared on only 2.0% of that volume. Advice terms had far less measured volume but a 92.8% rate.

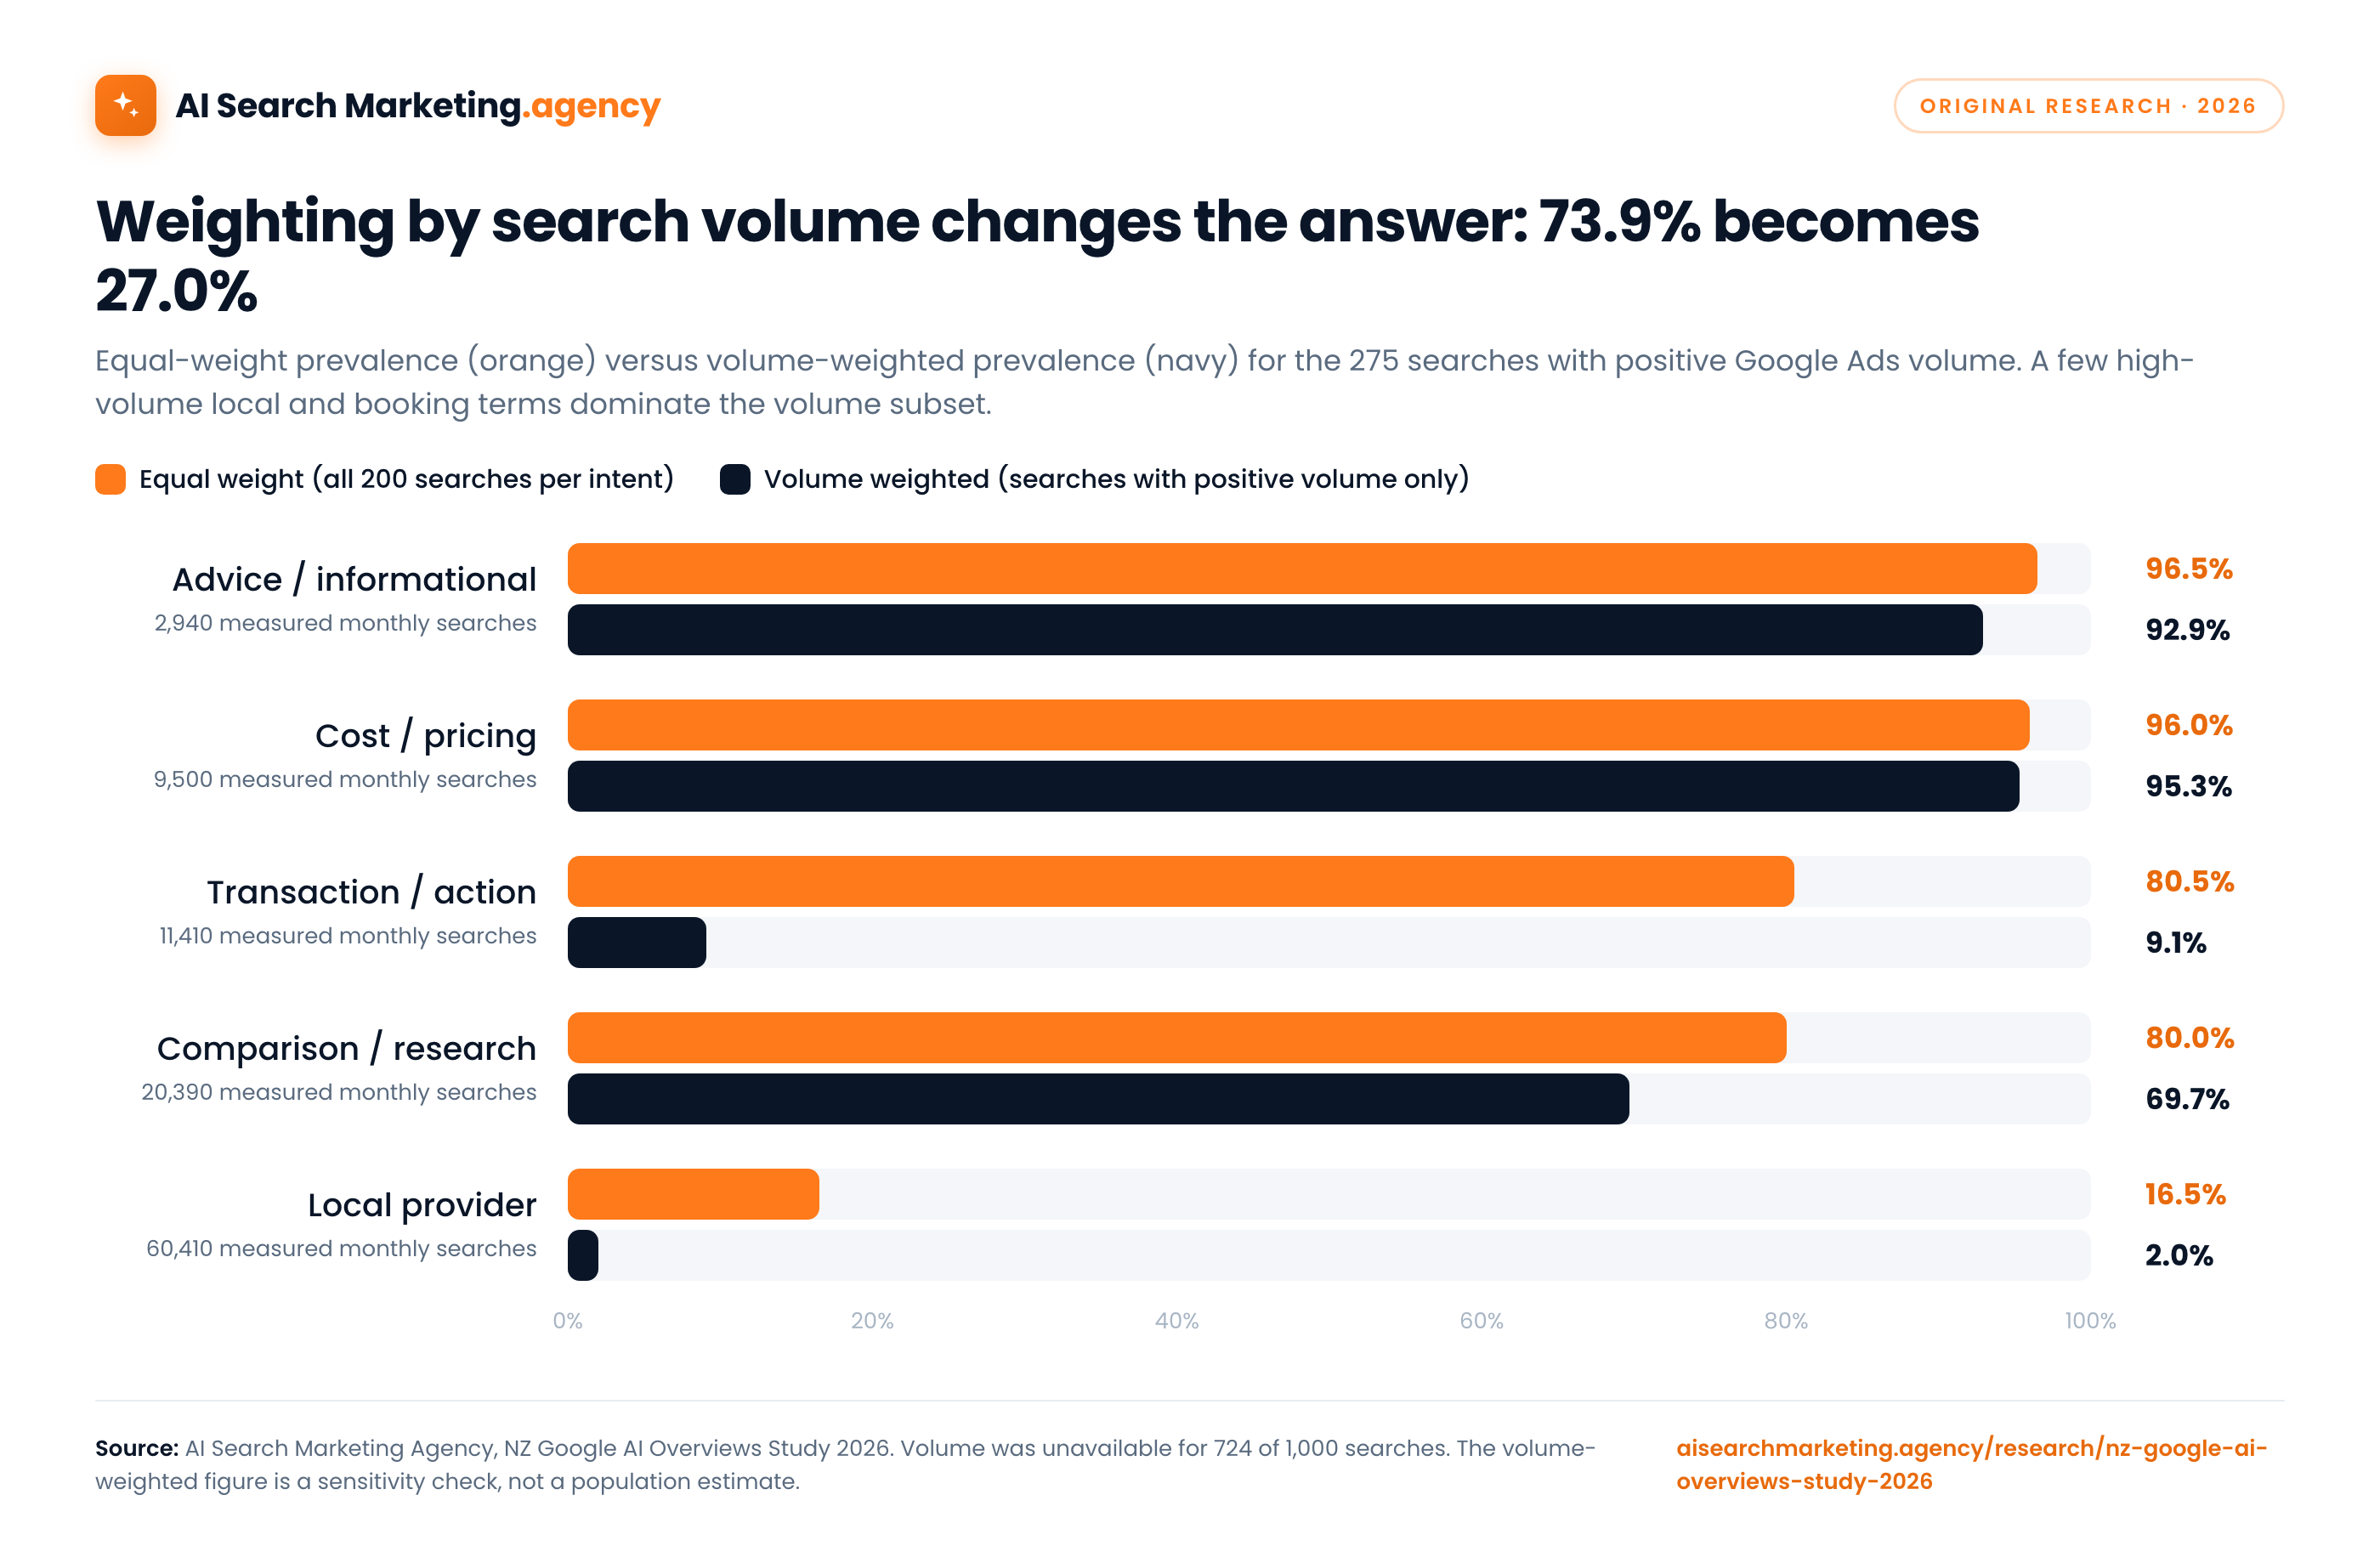
How to read this. Volume was unavailable for 724 queries, and the measured subset is dominated by a few broad local and booking terms such as "car rental auckland". The 27.0% figure is a check on how much the answer depends on weighting, not a competing national estimate.
The honest conclusion is that AI Overview exposure depends both on the type of query and on how a keyword portfolio is weighted. A balanced customer-journey portfolio can show heavy exposure even while a handful of high-volume local terms stay dominated by traditional results. We report both numbers because hiding either one would invite a misleading conclusion.
Who Google's AI Overviews cite in New Zealand
Each AI Overview in the dataset carries the list of domains it linked to. Across the 739 AI Overviews, 2,117 distinct domains were cited, with a median of 8 reference links and 7 distinct domains per answer. 80% of all citations went to .nz domains. This section is a descriptive look at that reference data rather than one of the study's planned tests.

| Rank | Domain | AI Overviews citing it | Share of the 739 | Origin |
|---|---|---|---|---|
| 1 | moneyhub.co.nz | 142 | 19.2% | New Zealand |
| 2 | youtube.com | 134 | 18.1% | Overseas |
| 3 | reddit.com | 112 | 15.2% | Overseas |
| 4 | consumer.org.nz | 50 | 6.8% | New Zealand |
| 5 | canstar.co.nz | 50 | 6.8% | New Zealand |
| 6 | facebook.com | 48 | 6.5% | Overseas |
| 7 | google.com | 40 | 5.4% | Overseas |
| 8 | one.nz | 40 | 5.4% | New Zealand |
| 9 | trademe.co.nz | 34 | 4.6% | New Zealand |
| 10 | xero.com | 29 | 3.9% | Overseas |
| 11 | spark.co.nz | 27 | 3.7% | New Zealand |
| 12 | westpac.co.nz | 25 | 3.4% | New Zealand |
| 13 | aa.co.nz | 25 | 3.4% | New Zealand |
| 14 | broadbandcompare.co.nz | 25 | 3.4% | New Zealand |
| 15 | sorted.org.nz | 23 | 3.1% | New Zealand |
| 16 | wise.com | 22 | 3.0% | Overseas |
| 17 | ami.co.nz | 21 | 2.8% | New Zealand |
| 18 | anz.co.nz | 19 | 2.6% | New Zealand |
| 19 | calculate.co.nz | 19 | 2.6% | New Zealand |
| 20 | healthnz.govt.nz | 19 | 2.6% | New Zealand |
Three things stand out. Comparison and consumer-advice publishers (MoneyHub, Consumer NZ, Canstar, Broadband Compare, Glimp) are cited far more often than the brands they compare. YouTube and Reddit are the only overseas sources in the top three, which mirrors what Google does elsewhere. And large NZ incumbents (One NZ, Spark, Westpac, ANZ, AA, Trade Me) earn citations for their own categories, but no single brand reaches 6% of answers. The full top 50 is in the download package.
What else was on the page
- Local packs: a local pack appeared on 285 of the 1,000 searches, including 182 of the 200 local-provider searches (91%). Only 20 local-provider searches had both a local pack and an AI Overview.
- People Also Ask: present on 921 searches (92.1%), which makes it more common than the AI Overview itself.
- Classic featured snippets: not one of the 1,000 searches returned a classic featured snippet. In this sample the AI Overview has taken over that slot.
- Answer length: the median AI Overview ran to 2,878 characters of text (range 340 to 8,885), so these are substantial answers, not one-line snippets.
What this means for New Zealand marketers
Audit by intent, not by total keyword count
An overall visibility percentage can hide an 80-point split. Separate advice, comparison, cost, transaction and local-provider queries before you judge exposure. That is how we run every AI Visibility Audit.
Treat cost content as AI search content
Price, fee and cost queries produced AI Overviews almost as often as informational questions. Clear pricing methodology, inclusions, exclusions, examples and region-specific caveats now matter in both organic results and AI-generated ones.
Protect the whole journey
Local-provider searches were less exposed, but the research and pricing steps immediately before them were not. A business can stay visible in the map pack while losing influence earlier in the decision.
Build source-worthy pages, not AI filler
Google says the same foundational SEO practices apply to AI features and that there is no special schema or technical requirement for inclusion. Pages still need to be indexable, snippet-eligible, useful and reliable. My technical SEO audit checklist shows how to check the first two, for Google and for AI crawlers. See Google Search Central's guidance on AI features. The citation table above shows who is currently clearing that bar. What the research on generative engine optimisation found points the same way: specific, well-sourced content is what gets used. That is the core of how I approach AI search optimisation.
Measure citations and conversions separately
Presence at the top of a results page establishes exposure, not traffic loss. This study did not observe impressions, clicks, leads or revenue. Google's generative-AI performance reporting in Search Console can be combined with analytics and conversion data to close that gap. For what this means for SEO budgets, see whether SEO is still worth it in 2026.
About the study
We built the sample from 20 industries and five search intents, with 10 searches in every industry and intent combination, so that every category carries the same weight. Every search was written and locked in before a single result was collected. A small pilot was set aside, and nothing was added, removed or reworded after we saw the results.
The results were captured on 8 September 2026 through DataForSEO, an independent search-data provider, using Google New Zealand, English-language, desktop settings. Only a genuine AI Overview at the top of the results page counted. Nested AI answers inside "People also ask" boxes did not.
We designed and directed the study. An OpenAI research model executed it under a fixed protocol, from locking the search list through collection, analysis and quality checks, and every step is logged. To test repeatability we re-ran 100 of the searches shortly afterwards and got the same answer on AI Overview presence 93% of the time. The entire data cost was about US$3.76.
What it cannot tell you. This is a balanced sample of commercial searches, not a survey of everything New Zealanders type into Google. It is a single-day desktop snapshot. It measures whether an AI Overview appeared and where, not clicks, traffic, revenue or whether the answer was accurate.
Download the data, workbook and charts
Everything is free to reuse under CC BY 4.0. Credit AI Search Marketing Agency and link to this page. Every CSV row carries source and licence columns, and every chart carries its source line.
- Complete package (ZIP)All data, the workbook, six charts, README and media release · 3.8 MB
- Research workbook (Excel)Eleven tabs: summary, intent, industry, cells, prominence, cited domains, raw results, search list, re-run check, cost ledger · 374 KB
- 1,000 results, row level (CSV)One row per search with AI Overview presence, position, length, cited domains and search volume · 879 KB
- Full 1,000-search list (CSV)The exact searches, as locked before collection, for replication · 272 KB
- Analysis by intent (CSV)Prevalence, confidence intervals and prominence per intent · 1 KB
- Analysis by industry (CSV)Prevalence, confidence intervals and prominence per industry · 4 KB
- Industry x intent cells (CSV)All 100 cells · 25 KB
- Most cited domains, top 50 (CSV)Citation counts and share per domain · 9 KB
- Re-run check (CSV)The 100 searches we ran a second time, with both results · 30 KB
- DataForSEO cost ledger (CSV)Every API charge, US$3.762 in total · 1 KB
- Full report (PDF)This page as a print-ready, branded PDF · 1.7 MB
- Media release (text)Publication-ready release for journalists and editors · 6 KB
Charts: use the "Download full-size PNG" link under each figure, or take all six from the ZIP. Read the package README.
Cite this study
Reference
In running text
Journalists: the media release is in the downloads, and Marcos Azaro is available for comment at [email protected].
Questions about the study
Does this mean 74% of all Google searches in New Zealand show an AI Overview?
No. The 73.9% figure comes from a balanced sample of 1,000 commercially relevant searches, with the same number of searches in every industry and intent group. It is designed to compare categories fairly, not to estimate the share of all New Zealand searches. A volume-weighted check on the 275 searches with search-volume data gave 27.0%, which shows how much the answer depends on what you count and how you weight it.
Why do local-provider searches trigger so few AI Overviews?
A search for a provider in a named city, such as a plumber in Hamilton, is usually answered by a local pack, a map and business listings. In this sample a local pack appeared on 91% of local-provider searches and an AI Overview on 16.5%. Google appears to reserve AI Overviews for queries that benefit from synthesis: explanations, comparisons, steps and price ranges.
Is the industry ranking reliable?
Treat it as a broad pattern. Each industry rate is based on 50 searches, so the confidence intervals overlap heavily and the industry effect is statistically small. The intent effect is large and consistent across every industry, and that is the finding we would act on.
Can I reuse the charts and data?
Yes. Everything on this page and in the download package is published under a Creative Commons Attribution 4.0 licence. Credit AI Search Marketing Agency and link to this page. Each chart carries a source line, and we ask that you keep it on the image.
Will the study be repeated?
That is the plan. The full list of 1,000 searches and the protocol are published so the same searches can be run again and compared like for like. Search results change, and the 93% agreement on our re-run is a reminder that any single snapshot carries some noise.
What did the study cost to run?
About US$3.76 in data charges, against a US$30 ceiling we set before collection started. The full cost ledger is in the download package. We publish it deliberately: this kind of research is cheap to run and only expensive to run honestly.
Do AI Overviews reduce clicks to websites?
This study can't answer that. It measured whether an AI Overview appeared, where it sat on the page and which sites it cited, not impressions, clicks or revenue. Presence at the top of a results page establishes exposure, not traffic loss. To see the effect on your own site, combine Google's generative-AI performance reporting in Search Console with your analytics and conversion data.
How does a business get cited in Google AI Overviews?
Google says the same foundational SEO practices apply to AI features and that there is no special schema or technical requirement. Pages need to be indexable, snippet-eligible, useful and reliable. Answer advice and cost questions directly, because those searches showed an AI Overview 96% of the time in this study. In New Zealand, comparison and consumer-advice publishers are cited most, so being covered by them matters too.
Find out where your own keywords sit
The free AI Visibility Audit tests the buying questions your customers ask across Google AI Overviews, ChatGPT, Perplexity and Gemini, split by intent the way this study is, and shows you where competitors are cited instead of you. No cost, no obligation, New Zealand or overseas. If your category gets very few searches in the first place, The Thin Market Playbook covers what to do instead.
Book Your Free Audit